

In July we argued that Uber’s real problem wasn’t the size of its AI bill. It was that nobody could connect the spend to what shipped. Four months on, most organisations still can’t. Here’s the measure that would have helped: cost per outcome that sticks, worked through with real arithmetic, and a one-page template you can fill in this month.
Uber spent its full-year AI budget in four months this year, driven by AI coding tools such as Claude Code. By June it had capped every employee at $1,500 a month in token spending per AI coding tool. The overspend got the headlines, but it wasn’t the most telling part. Talking to Fortune in May about the link between Uber’s rising token consumption and the features it actually ships, chief operating officer Andrew Macdonald said: “That link is not there yet.”
Uber isn’t unusual. Accenture’s CIO’s Guide to AI Tokenomics, based on a survey of 750 executives at companies with more than $1bn in revenue, found that “only 35% of organizations can calculate cost per business outcome even for their single largest use case.” Another 59% work from directional estimates. And “only one dollar in five of enterprise token spend shows up as a quantified financial outcome.”
The FinOps Foundation’s State of FinOps 2026 shows how fast the problem has landed on practitioners’ desks. 98% of respondents now manage AI spend, up from 63% in 2025 and 31% in 2024. One practitioner quoted in the report put it plainly: “Is your AI providing value? No one can answer that question yet.”
Almost everyone now manages AI spend. Almost nobody can say what it buys.
The Squeeze Is Coming From Both Sides
Boards want a return, and they want it soon. Accenture’s October Pulse of Change survey of 3,000 C-suite leaders found that 53% expect measurable ROI from AI within 12 months, rising to 87% within 24 months. Only 15% are redesigning end-to-end processes, which is where most of that return would come from. The same leaders expect token consumption to grow 78% over the next two years.
CIOs are feeling it. Gartner’s 2027 CIO and Technology Executive Agenda survey of 2,002 CIOs and technology executives found that only 13% say their organisation has realised significant or transformational value from AI. 58% face more pressure to deliver cost improvement from AI, and 51% expect AI to raise their total cost of ownership. Gartner’s Alicia Mullery explained why the budget is so hard to hold: “AI costs are probabilistic and determined at run time.”
The cloud bill tells the same story. Flexera’s 2026 State of the Cloud report found that self-reported wasted cloud spend rose to 29%, the first increase in five years, as cloud-based AI workloads surged. Generative AI is now the third most widely used public cloud service, used by 58% of respondents, up from 50%. Even the tools that used to be priced per seat are moving to the meter: GitHub moved every Copilot plan to usage-based billing on 1 June 2026.
Boards expect a return within a year, and the meter’s running faster than the work is changing.
Why Cost per Token Is the Wrong Unit
Tokens measure activity, not results. An agent that loops on a problem for an hour burns more tokens than one that solves it first time, and a cheaper model can still produce dearer outcomes if its work has to be done again. Cutting the token bill without measuring what it bought is how organisations swap runaway cost for throttled work.
The FinOps Foundation’s guidance on FinOps for AI points to a better unit. It recommends tracking “cost per inference, per user, and per successful outcome for each use case”, and defines cost per successful outcome as the “cost of results that meet the quality bar”. That quality bar is the part most AI cost dashboards leave out.
The people count too. Review time and rework are part of what an outcome costs. An AI coding tool that writes twice as much code but doubles the time senior engineers spend reviewing it can raise the cost of each change even while the token bill looks healthy. We’ve made the same argument about where AI’s return hides in the error tail: the errors you have to catch and fix decide the value.
The Model: Cost per Outcome That Sticks
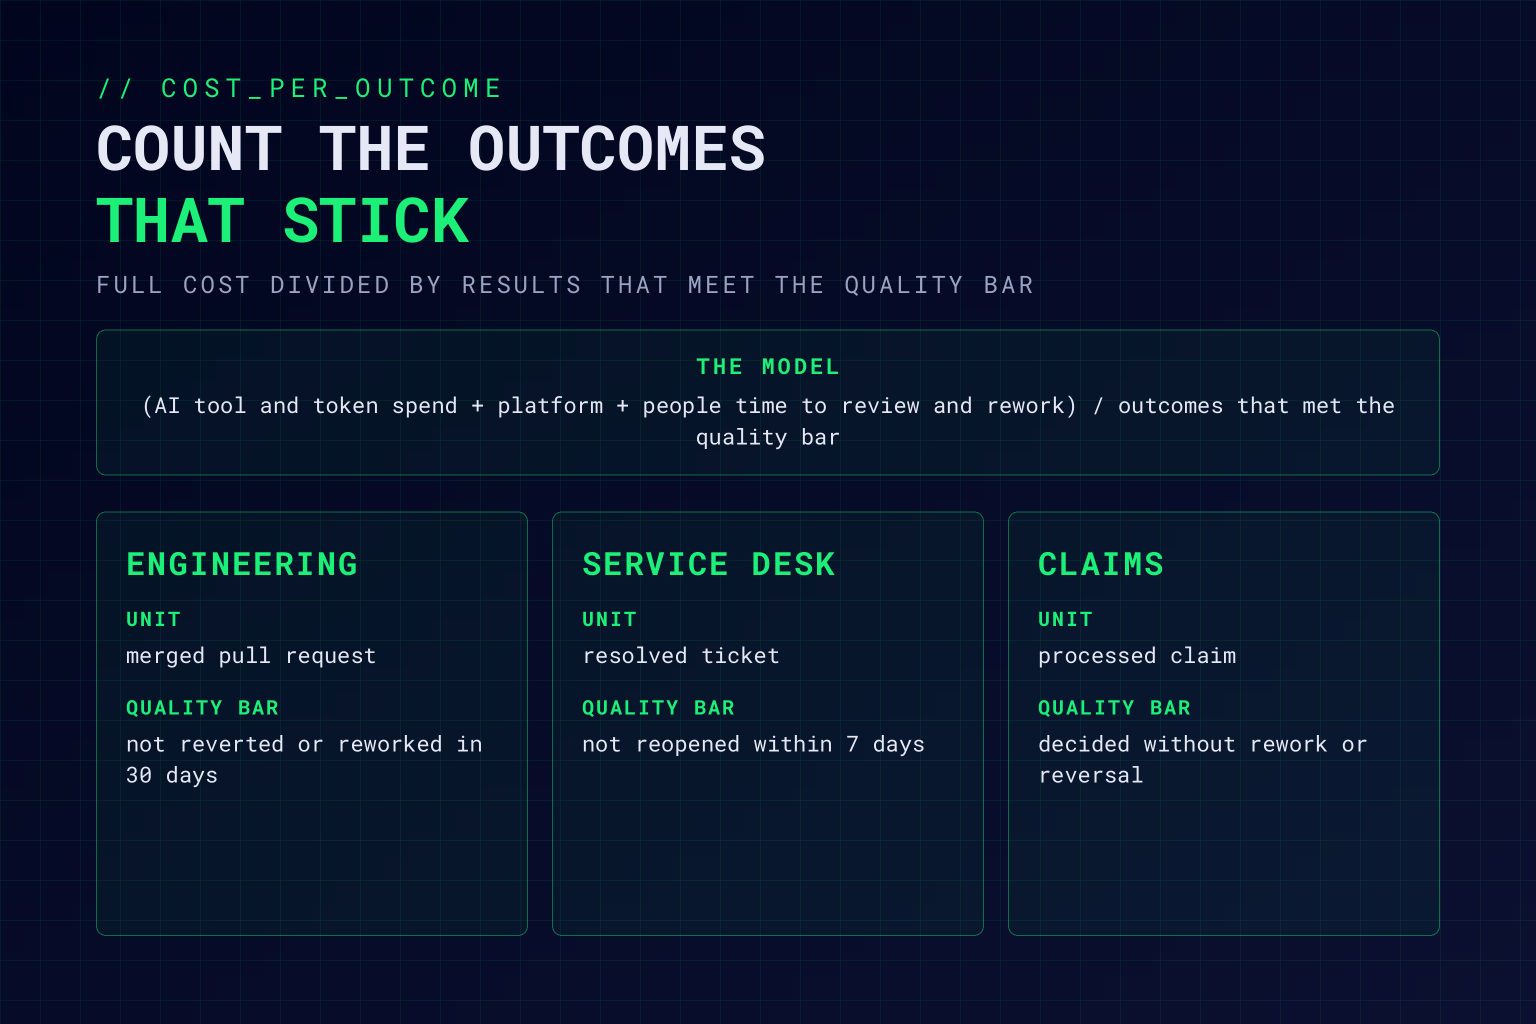
The model fits on one line:
Cost per accepted outcome = (AI tool and token spend + the platform it runs on + the people time to review, correct and rework) ÷ the outcomes that met the quality bar.
The quality bar is what turns a vanity metric into a real one. Count only the outcomes that stick. In software engineering, that’s a merged pull request that hasn’t been reverted or substantially reworked within 30 days. On a service desk, it’s a ticket resolved and not reopened within seven days. In claims processing, it’s a claim decided without rework or reversal. Accenture’s tokenomics report lands in the same place, naming “cycle time and accepted contributions per developer” as the value measure for software development, and “cost per resolved interaction” for customer operations.
A Worked Example
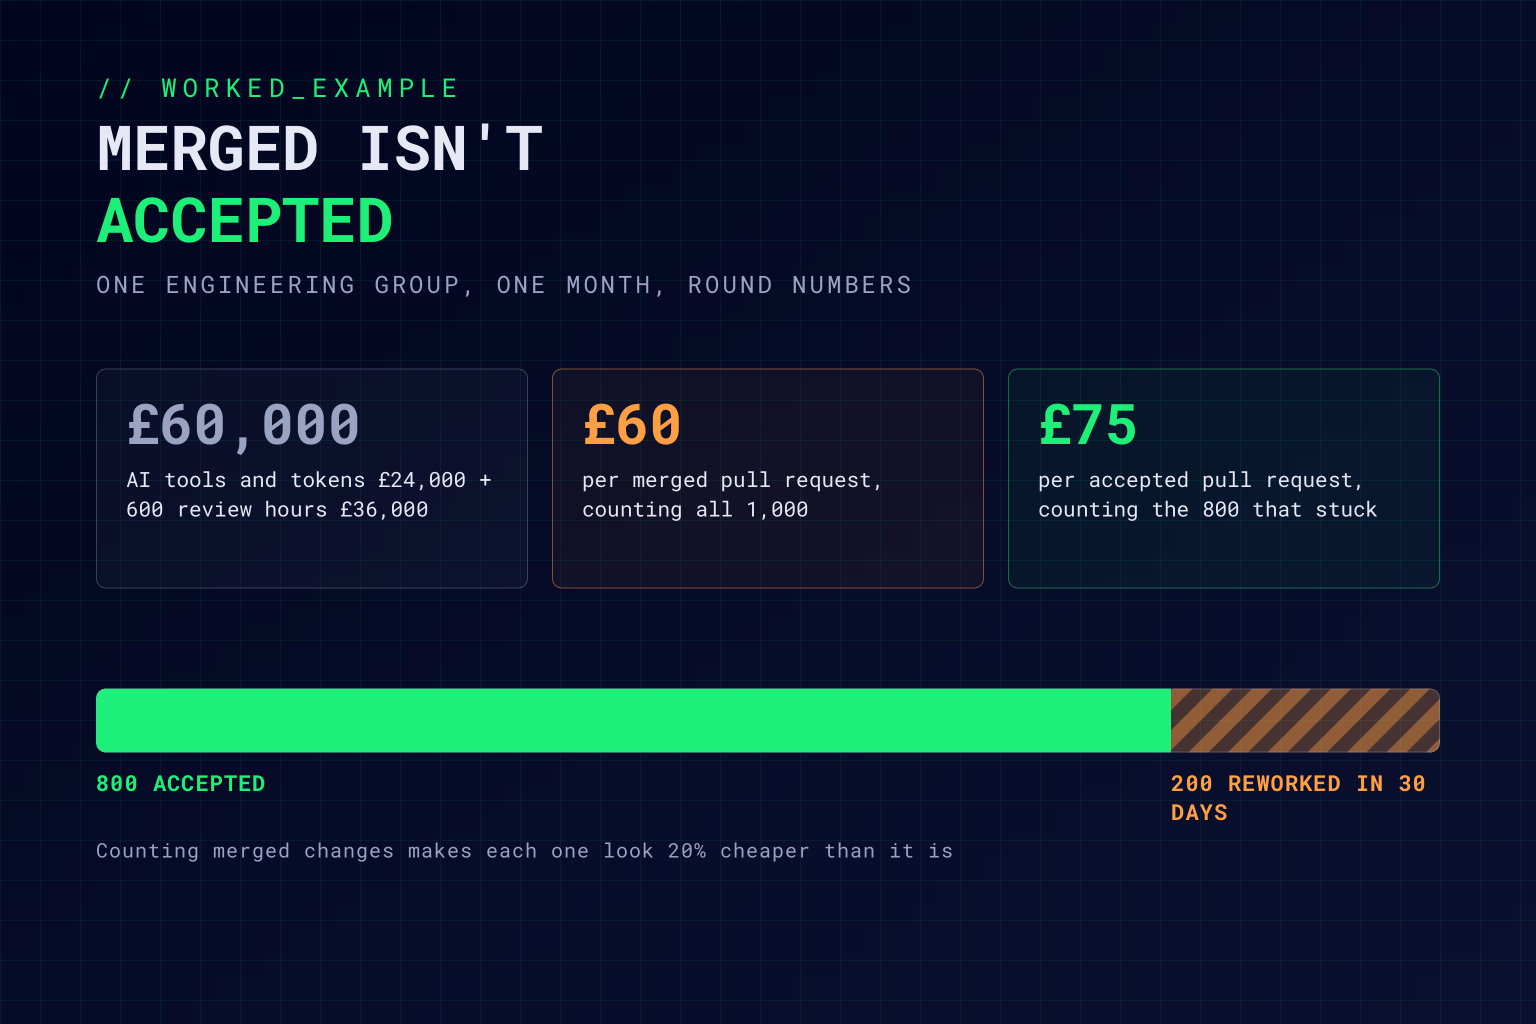
Take an engineering group with these round numbers for one month. Its AI coding tools and tokens cost £24,000. Its engineers spend 600 hours reviewing AI-assisted changes, at a loaded cost of £60 an hour, which adds £36,000. The total is £60,000. It merged 1,000 pull requests, and 200 of them were reverted or substantially reworked within 30 days.
Divide by everything merged and each change costs £60. Divide by the 800 that stuck and each one costs £75. Counting merged changes rather than accepted ones makes every change look 20% cheaper than it really is.
The number means little on its own. Compare it with the same team’s cost per accepted change before AI tools, and track it month by month. If token spend rises while cost per accepted change falls, the spend is earning its place. If both rise, you’ve found Uber’s problem before your budget does.
The One-Page Template
Fill in one column per use case. Start with whichever use case carries your largest AI spend, and agree the quality bar before anyone looks at the numbers.
| Field | Engineering | Service desk | Claims |
|---|---|---|---|
| Unit of outcome | Merged pull request | Resolved ticket | Processed claim |
| Quality bar | Not reverted or substantially reworked within 30 days | Not reopened within 7 days | Decided without rework or reversal |
| Costs to count | AI tool and token spend, extra pipeline compute, review and rework hours | Model and platform spend, time spent on escalations | Extraction and model spend, handler review time, rework |
| Baseline | Cost per accepted change before AI tools | Cost per resolution with people only | Cost per claim on today’s process |
| Watch alongside | Cycle time, review time per change | Customer satisfaction, escalation rate | Time to decision, claims leakage |
| Owner | Engineering lead | Service desk manager | Claims operations lead |
Putting It to Work
Tag spend where it happens. You can’t divide a cost you can’t attribute. Tag AI spend by team, tool and workflow at source, closer to real time than a monthly invoice. We covered how in Seeing What You Can’t Control.
Report the spread, not just the average. The FinOps Foundation recommends reporting these metrics as distributions. A handful of heavy users or runaway agents can hide behind a healthy average, and they’re usually where the waste is.
Put cost and outcome in front of the same people. Uber’s leaderboards ranked engineers by how much AI they used, so the people driving consumption weren’t the people answerable for the bill. A cost-per-outcome figure on a team’s own dashboard changes the conversation from “use more” to “use well”.
Set guardrails, not gags. Caps work when they come with visibility and an easy way to ask for more. Build them into the platform, as we described in Automated Governance, rather than issuing them as a memo. As agents start to spend money on your behalf, the same discipline has to reach them too.
The goal isn’t the lowest AI bill. It’s knowing what each pound of it bought.
Q&A: Measuring AI Spend by Outcome
What went wrong with Uber’s AI budget?
Uber spent its full-year AI budget in four months in 2026, driven by AI coding tools, and then capped employees at $1,500 a month per tool. Its chief operating officer said the company couldn’t yet link rising token consumption to the useful features it shipped. The missing piece was a measure of value, not a lower bill.
What is cost per outcome for AI?
It’s the full cost of an AI-assisted result divided by the results that met an agreed quality bar. The cost includes AI tool and token spend, the platform it runs on, and the people time spent reviewing, correcting and reworking the output.
How do you measure the cost of AI-assisted software development?
Add AI tool and token spend, extra pipeline compute and review and rework hours for a period, then divide by the merged pull requests that weren’t reverted or substantially reworked within 30 days. Compare the result with the team’s cost per accepted change before AI tools.
Why isn’t cost per token a good measure of AI value?
Tokens measure activity, not results. A cheaper model can produce dearer outcomes if its work has to be redone, and an agent that loops burns tokens without delivering anything. Cost per accepted outcome captures quality and people time that token counts miss.
How many organisations can measure AI cost per outcome?
Few. Accenture’s tokenomics research found only 35% of large organisations can calculate cost per business outcome even for their single largest AI use case, and only one dollar in five of enterprise token spend shows up as a quantified financial outcome.
Working Through This With Vertex Agility
As an AI-native transformation consultancy, we help organisations get the productivity AI offers and prove it. Our Cloud Cost Engineering Service makes AI and cloud spend visible, attributable and governed, and our Software Consultancy practice builds AI-Augmented Engineering Pipelines, where AI-assisted code generation, review and testing sit inside CI/CD with senior engineers governing every decision. We work across the major model and tool providers, so the advice is about matching spend to outcome, not defending a licence line.
If you’d like a quick read on where you stand, our free AI Readiness Audit scores your strategy, data, skills and governance alongside your cost discipline: whether you can tie technology costs to outcomes, and whether you’d spot abnormal spend before the invoice does.